Staying Home, Limiting Contagion Hubs – Including Hospitals, Schools, and Workplaces – May Curb COVID-19 Deaths
0 View

- Publish Date:
- 30 August, 2021
- Category:
- Covid
- Video License
- Standard License
- Imported From:
- Youtube
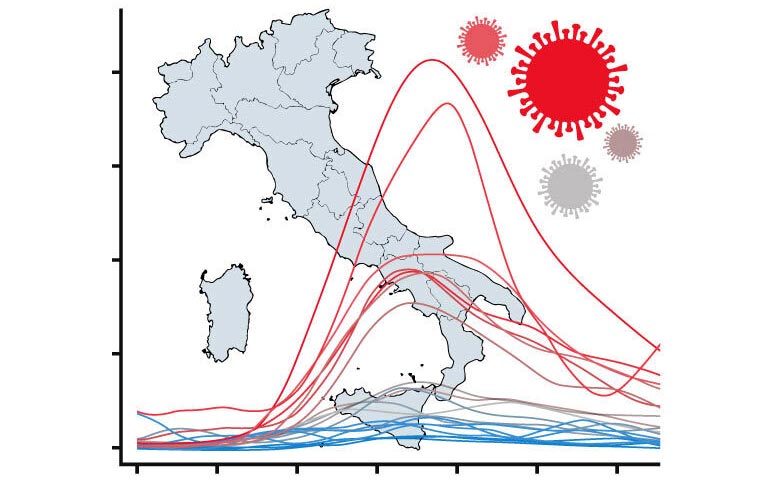
A new study examines why the first wave of the COVID-19 epidemic was so much more intense in some regions of Italy than in others. The graph shows mortality in each of the 20 Italian regions over time, aligned with outbreaks starting on different dates. Credit: Penn State
New study uses new statistics to understand why some regions of Italy were hit harder than others during the first wave of the pandemic.
Staying home and limiting local travel, supporting access to primary care and limiting contacts in contagion hubs — including hospitals, schools and workplaces — are strategies that can help reduce COVID-19-related deaths, according to new research. The research team, by statisticians from Penn State, the Sant’Anna School of Advanced Studies in Pisa, Italy, and Université Laval in Quebec, Canada, used new statistical approaches to compare and contrast the first wave of the epidemic in 20 regions in Italy. identify factors that contributed to mortality.
“The first wave of the COVID-19 epidemic took very different paths in different regions, with some areas being hit particularly hard, while others faring much better,” said Francesca Chiaromonte, research team leader, professor of statistics and holder of the the Lloyd and Dorothy Foehr Huck Chair in Statistics for the Life Sciences at Penn State, and the Science Coordinator of the EMbeDS Division of Excellence at the Sant’Anna School. “We wanted to understand why some regions were hit so much harder than others, so we used both vetted and newly developed techniques in a field of statistics called functional data analysis to compare how the first wave progressed in different regions in Italy.”
Rather than focusing on models for predicting epidemic trajectories, the study used functional data analysis techniques to collect information from the shapes of mortality curves over time, providing a sensitive way to establish associations and patterns from data. to lay. The researchers compared mortality curves during the first wave of the epidemic in 20 regions in Italy. After clustering and aligning the curves to characterize their shapes and account for outbreaks starting on different dates, the researchers were able to evaluate factors that could contribute to their differences. Their results appear Aug. 30 in the journal Scientific Reports.
The researchers found that local mobility — how many people moved through their local areas — was strongly associated with COVID death. Specifically, they used data from Google’s “groceries and pharmacy” category, which reflects mobility associated with acquiring necessities such as food and medicine. During a national lock-down that began in March 2020, these mobility levels dropped dramatically in Italy, roughly 30% in the first week of lockdown only and then further by as much as 60% during weekdays and almost 100% during weekends in March and April. .
“At the beginning of the epidemic, there were many questions about whether mobility restrictions would really work; our results add to the mounting evidence that they do,” Chiaromonte said. “We’re seeing the effect with some delay, but as people reduced their mobility, we saw fewer COVID-related deaths. And we’re not the only ones documenting this.” , so if we’re told to stay home as a mitigation measure, we should stay home!”
The rates of positive COVID tests and mortality were also associated with a delay, according to the study, reaffirming that positivity is a useful measure to include in disease models.
The research team also examined different demographic, socioeconomic, infrastructural and environmental factors one by one to see if they could further explain patterns in mortality. These include factors such as the percentage of the population over 65, prevalence of pre-existing conditions such as diabetes and allergies, accessibility of primary care and ICU beds, and factors that could increase the contact rate, such as the number of beds in a hospital or nursing home. and the number of students per classroom.
“Based on the associations captured by our statistical techniques, maybe it’s not so much having large luxury hospitals with many ICU beds, but rather good access to primary care physicians, which reduces mortality,” Chiaromonte said. “In fact, having large hospitals could have backfired because they acted as contagion hubs. The places where you have more beds per hospital, more beds per nursing home, more students per classroom, and more employees per company are where epidemics are strongest. goods.”
With additional research to confirm these trends, these results could inform decision-making, for example encouraging short- and medium-term investment to boost distributed primary health care and limiting contacts in contagion hubs. Schools and workplaces could encourage pods, where students and staff see only a limited group of individuals, and hospitals could segment sections to reduce contacts.
“Importantly, however, even if we control for these factors in our statistical analyses, mobility still remains a very strong delayed predictor of mortality,” Chiaromonte said. “And even taking into account mobility, positivity rates and the other factors we considered, we still can’t fully explain why the epidemic was so much more intense in Lombardia, a northern industrialized region that includes Milan, compared to the rest. of the country. . They are still an outlier from what our models can explain. By increasing access to accurate, timely and high geographic resolution data, we and other researchers can validate the results and improve our ability to explain the most extreme trajectories, such as those observed in Lombardy during the first wave of COVID-19.
The limited availability and accuracy of data posed several challenges for this study. For example, official death rates reflected severe underreporting early in the epidemic, so the research team also integrated information on differential mortality — differences in overall deaths in 2020 compared to the average death rate over the past five years. However, more accurate information on deaths, as well as cases and hospitalizations, on a finer geographic scale and possibly broken down by gender, age, pre-existing conditions and other characteristics, would allow the team to improve their models. In addition, demographic, socio-economic, infrastructural and environmental data are often reported on a coarse geographic scale and are often outdated for several years.
“Some progress has been made since the start of the pandemic, but we hope that in the future government agencies, statistical agencies and other groups will really prioritize collecting, integrating and making data available to qualified researchers,” Chiaromonte said. “All the ambiguities and questions we had at the beginning, and in some cases still have, about where infections are happening, whether the virus is spreading in restaurants or gyms or on public transport, or whether certain restrictive measures are working – we would can answer many questions more effectively with good data. We are already trying to capitalize on the progress – for example, Google has made their mobility measures available with finer geographic resolution and we are using them to analyze the second wave of the COVID-19 epidemic in Italy. But we cannot stress enough the importance of having access to accurate, granular and current information about the epidemic and about the many variables that can contribute to worsening or mitigating it.”
Reference: August 30, 2021, Scientific Reports.
DOI: 10.1038/s41598-021-95866-year
In addition to Chiaromonte, the research team includes Tobia Boschi, a statistics graduate student at Penn State; Jacopo Di Iorio, a postdoctoral fellow at Sant’Anna School and soon to be an Eberly Postdoctoral Research Fellow at Penn State; Lorenzo Testa, a graduate student at Sant’Anna School who is currently visiting Penn State; and Marzia Cremona, a former Bruce Lindsay Visiting Assistant Professor in the Penn State Department of Statistics, who is now an Assistant Professor of Data Science at Université Laval in Quebec, Canada.