Sounds of COVID Lockdown & Reopening Recorded by Underground Fiber Optic Sensors
0 View

- Publish Date:
- 28 June, 2021
- Category:
- Covid
- Video License
- Standard License
- Imported From:
- Youtube
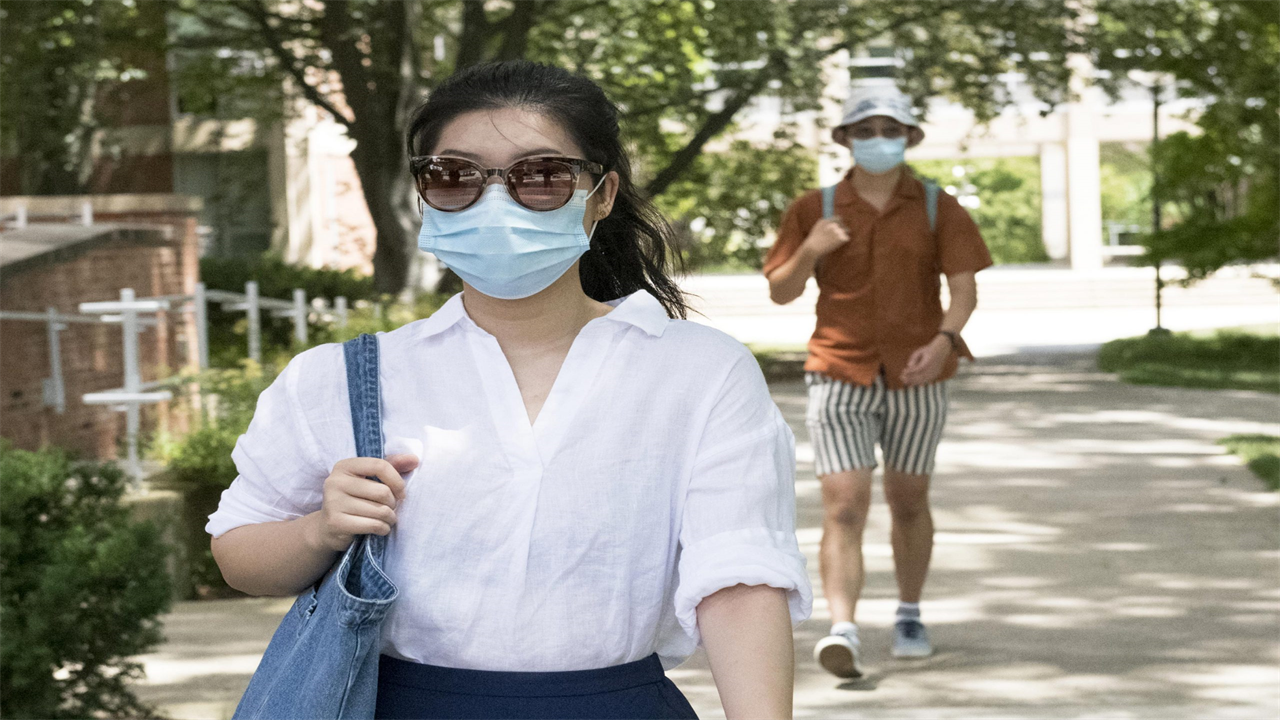
Students walk on the campus of University Park in Penn State. Credit: Patrick Mansell, Penn State
In March 2020, everyday life in the United States changed in an instant as the country went into lockdown to cope with the first wave of the COVID-19 pandemic. New research reveals how residents in one community resumed their routines when restrictions were lifted, according to a team of Penn State scientists.
“We used sound signals captured by underground fiber optic sensors to understand how COVID measures affected human activities,” said Junzhu Shen, a graduate student of geosciences at Penn State. “These sensors provide highly accurate, high-resolution data that can help us understand what’s happening in our communities.”
The scientists analyzed noise data recorded from March through June 2020 in and around the campus of Penn State University Park and State College, Pennsylvania. They observed a quiet period coinciding with the shutdown, followed by a recovery in activity as the area moved from red to less restrictive yellow and green phases.
By listening for small changes in surface vibrations, the scientists found that construction activity and car traffic recovered faster than pedestrian traffic. They reported their findings in the open access journal The Seismic Record.
“Footsteps disappeared and didn’t really recover after the company reopened in late May,” said Tieyuan Zhu, an assistant professor of geosciences at Penn State. “But if you look at car traffic, you see a different pattern. It subsided and recovered. This may give us a hint that people were conservative, working remotely and driving when they had to go out for things like grocery shopping.”
Other work to measure the impact of COVID shutdowns on human activity has used seismic sensors or Google mobility data — GPS information collected from devices such as cell phones. But using the fiber optic network allows for higher-resolution data, with measurements collected about every six and a half feet, the scientists said.
“With mobility data from Google, we’re limited to looking at one data point for the entire province,” Zhu said. “It is difficult to separate one community from another. With our high-density network, we can understand the noise variation from one block to another.”
The scientists analyzed data from March, when the lockdown began and Penn State students left the campus, to June, when the area entered Pennsylvania’s green phase of reopening.
The results provide a useful assessment tool for decision-makers faced with the implementation of such measures and could lead to a better understanding of the impact of pandemics on human activities, the scientists said.
To conduct the research, the scientists used miles of uninterrupted fiber optic cables for telecommunications among the university and the nearby community. Often found in cities, these networks provide telephone and Internet services to homes and businesses.
A new technology, a distributed acoustic sensing (DAS) array, allowed the researchers to send a laser through one of the hair-thin glass fibers in the cables and detect small changes caused by pressure. By taking measurements every six-and-a-half feet, the scientists can essentially create a network of 2,000 sensors.
“Even if there is a small change in the external energy on the ground above it, that will stretch or compress the fiber, and we can detect those changes,” Zhu said. “And in the case of COVID, we can provide some indicators to understand whether the measures taken are effective or not.”
Reference: June 28, 2021, The Seismic Record.
A seed grant from the Penn State Institutes of Environment and Energy and the seed grant from the Institute of Computational and Data Science supported this work.